Philippines logistics costs at 27% of GDP: why the gap to Thailand and Indonesia matters for export competitiveness
8 May 20264 min read
Summary
- Logistics costs in the Philippines are estimated at approximately 27.5% of GDP — more than double Thailand's 11.1% and nearly double Indonesia's current 14%, which Jakarta reduced from 24% through a decade of supply chain digitalisation anchored in the National Logistics Ecosystem (NLE) platform.
- The cost gap sits primarily in inter-island freight: the Philippines' 7,000-island geography concentrates inefficiency at the roll-on/roll-off and small feeder vessel level, where vessel age, port congestion and informal handling charges add cost at every island transition.
- Until port infrastructure in secondary hubs — Cebu and Davao in particular — reaches the capacity and service quality needed to attract liner calls and reduce transhipment via Manila, the multi-hub logistics model that would structurally reduce the GDP cost share remains operationally out of reach.
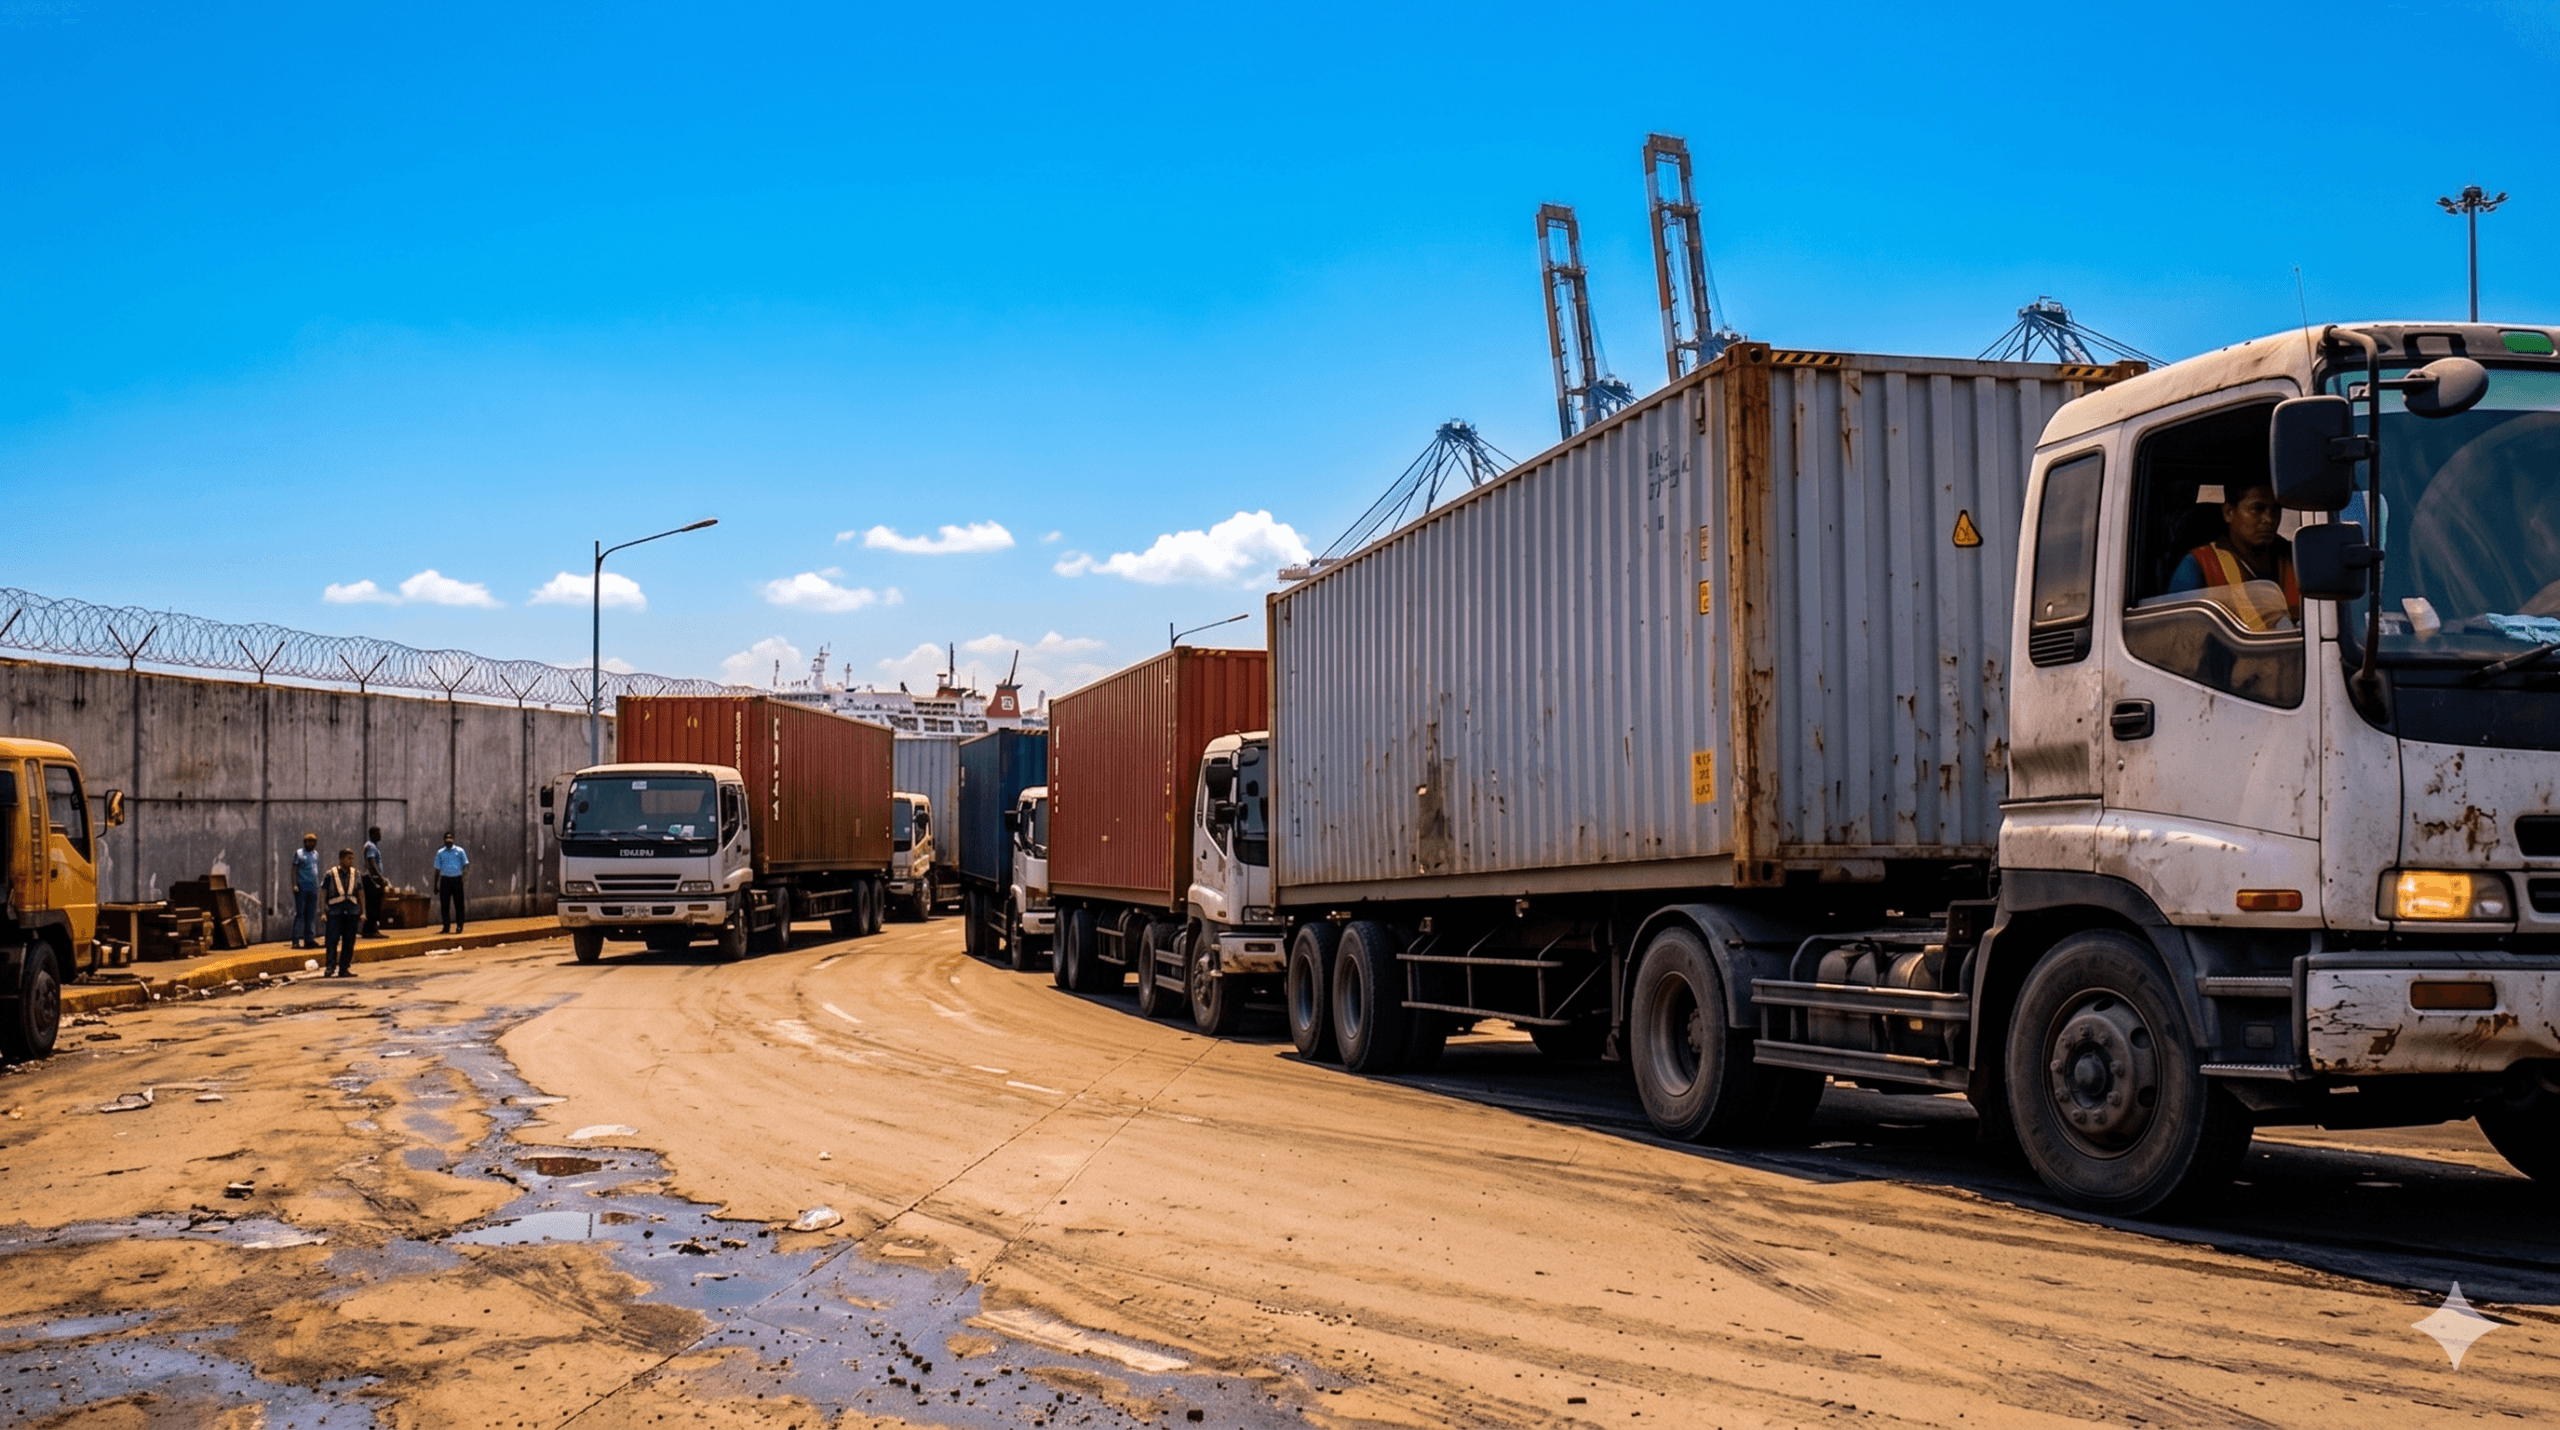
The Philippines carries one of the highest logistics cost burdens in Southeast Asia, with estimates placing the sector at approximately 27.5% of gross domestic product. The figure, drawn from the Asian Development Bank’s assessment of Philippine supply chain efficiency, reflects the compound costs of inter-island freight, port congestion at Manila’s international terminals, road infrastructure constraints in major production zones, and an informal handling layer at provincial ports that adds friction at every link in the chain.
The regional comparison
The regional comparison sharpens the picture. Thailand’s logistics costs stand at approximately 11.1% of GDP according to the World Bank Logistics Performance Index 2023 and Thailand’s National Logistics Report 2023, a level broadly consistent with upper-middle-income economies with mature road and rail networks.
The Indonesia reform trajectory
Indonesia presents the more instructive comparison because it represents a documented reform trajectory. As recently as 2015, Indonesia’s logistics costs were estimated at approximately 24% of GDP — a figure that reflected the archipelago geography, fragmented regulatory oversight across multiple port authorities, and high dwell times (the average time cargo sits at a port before being collected or loaded) at Tanjung Priok, Indonesia’s main container port in Jakarta. The Jokowi administration’s National Logistics Ecosystem (NLE) programme, launched in 2021 and expanded through 2023, integrated customs systems, port operators, freight forwarders and trucking companies onto a single digital platform, reducing redundant documentation, shortening port dwell times and creating a unified data layer for border clearance. By 2023, Indonesia’s National Development Planning Agency (Bappenas) placed the country’s logistics cost at approximately 14% of GDP — a reduction of ten percentage points over eight years, with the NLE credited as the primary structural driver.
The Philippines' reform challenge
The Philippines has launched its own logistics reform agenda. The Department of Transportation’s Logistics Roadmap and the Philippine Ports Authority’s port modernisation programme address parts of the cost structure. But the 27.5% figure reflects structural realities that digitalisation alone cannot resolve: the cost of moving a container between Mindanao and Metro Manila includes multiple vessel handoffs, port handling charges at both origin and destination, and land transport legs that the road network does not efficiently support. The NLE model that worked in Indonesia was built on a largely contiguous land mass where road and rail could carry most of the freight; the Philippines’ inter-island reality requires a different architecture.
The production geography that bears the heaviest logistics burden sits in CALABARZON — the corridor of provinces comprising Cavite, Laguna, Batangas, Rizal and Quezon south of Metro Manila. CALABARZON is the country’s dominant manufacturing belt, hosting electronics export assembly for companies including Texas Instruments and Canon, auto parts manufacturing serving Japanese and Korean OEMs (original equipment manufacturers), and pharmaceutical production. Goods produced there move to Manila’s port for export, adding a trucking leg through one of Asia’s most congested urban corridors before they reach a container terminal.
The production geography that bears the heaviest logistics burden sits in CALABARZON — the corridor of provinces comprising Cavite, Laguna, Batangas, Rizal and Quezon south of Metro Manila. CALABARZON is the country’s dominant manufacturing belt, hosting electronics export assembly for companies including Texas Instruments and Canon, auto parts manufacturing serving Japanese and Korean OEMs (original equipment manufacturers), and pharmaceutical production. Goods produced there move to Manila’s port for export, adding a trucking leg through one of Asia’s most congested urban corridors before they reach a container terminal.
The port infrastructure constraint
Reducing Philippine logistics costs to Indonesian or Thai levels over a comparable reform horizon would require addressing the port infrastructure gap in secondary hubs. Cebu and Davao, the country’s second and third cities, lack the quay length, crane capacity and container yard depth to attract direct calls from major carriers on Asia trade lanes. Until that changes, cargo from the Visayas and Mindanao tranships through Manila, adding a leg that Thailand’s Laem Chabang-anchored model does not require. The ADB’s assessment of Philippine port infrastructure identifies Cebu and Davao as the critical nodes whose development would enable a multi-hub logistics model — and concludes that at current investment levels, neither will reach the required capacity threshold within five years. That gap, more than any regulatory or digitalisation shortfall, is what keeps the 27.5% figure where it is.